New Relic CodeStreamShift left by making code performance part of the earliest stages of the development process.
Requirements
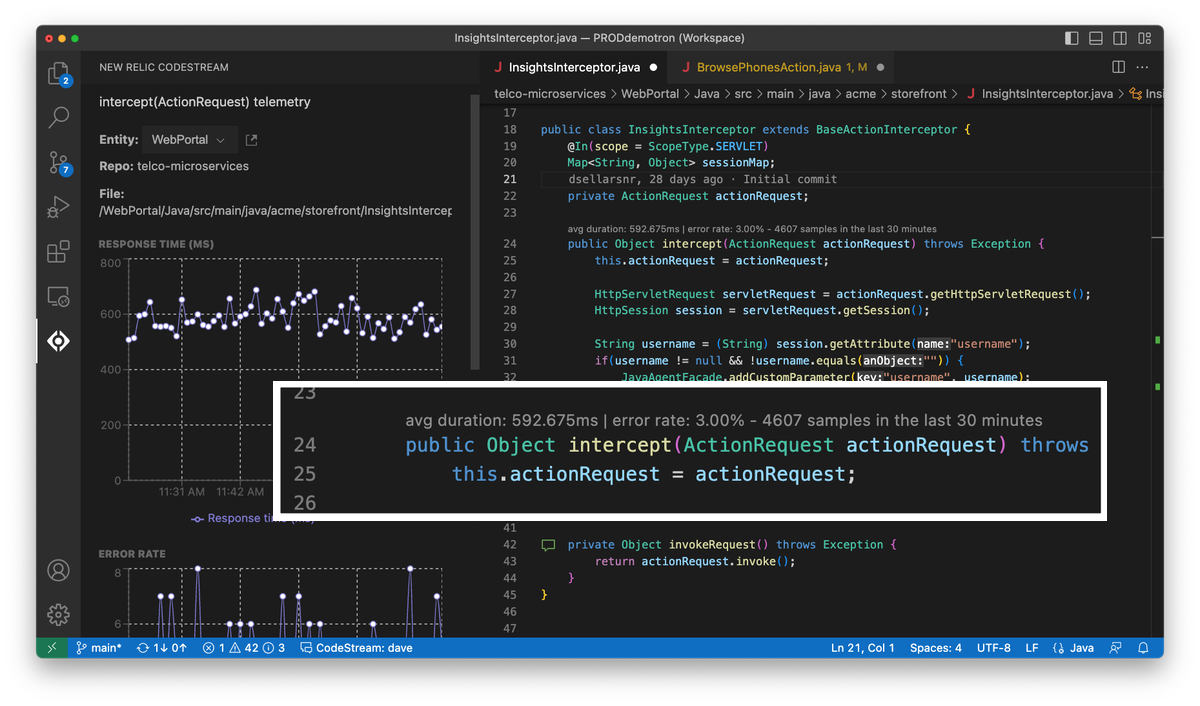
Code-Level MetricsSee performance data, at the method level, right in your editor. Always-on view ensures that performance issues are factored into the work at hand. You can even see metrics for your lower environments, and head off performance issues before they hit production.
Log SearchNo need to slow down your investigation by context switching between your IDE and your browser to search logs. CodeStream brings the New Relic log-search experience right into your IDE! You can even search for output from specific log lines in your code.
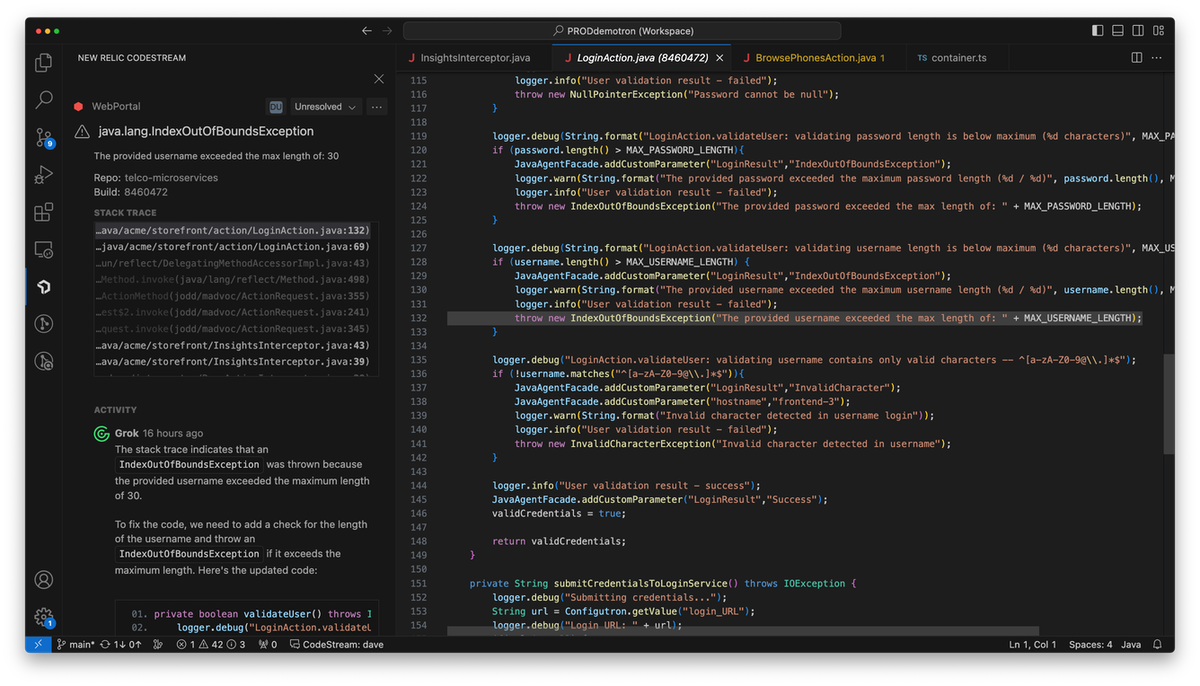
Error InvestigationDiscover errors happening in the code you’re responsible for. Quickly step through the stack trace, with CodeStream automatically taking you to the correct file and line number, then bring relevant teammates into the discussion so that you can resolve the issue as quickly as possible.
Performance MonitoringGet an in-IDE view of how the services built from your code are performing, in any environment. Golden metrics, service-level objectives and related services give you the big picture at a glance.
Don't have New Relic?Become a hands-on observability practitioner by creating a free account. Your free account includes 100 GB/month of free data ingestion, one free full-platform user, and unlimited free basic users. Learn how engineering teams are using New Relic free tier to monitor their stack. Help & FeedbackCheck out the user guide for more information on getting started with New Relic CodeStream. Please follow @newrelic for product updates and to share feedback and questions. You can also contact support. |